-1.png?height=120&name=BLAU__EMBLEMA%20PRINCIPAL%20SENSE%20ESLOGAN%20(1)-1.png)
If you want to analyze the impact and interaction of the attendees at your virtual event, Meetmaps offers various reports for evaluation.
Metrics 🔢 are fundamental numerical indicators to measure the impact 💯 of your virtual event. They provide information about the various activities you have conducted during your event and the reception from attendees when they participate in them.
App & Web > Metrics > General

TIP 💡: If you want to know the difference between the types of attendee statuses, click here👈.
Modules: shows the number of views in the modules from the mobile app. You can download the information using the "Export" button. 
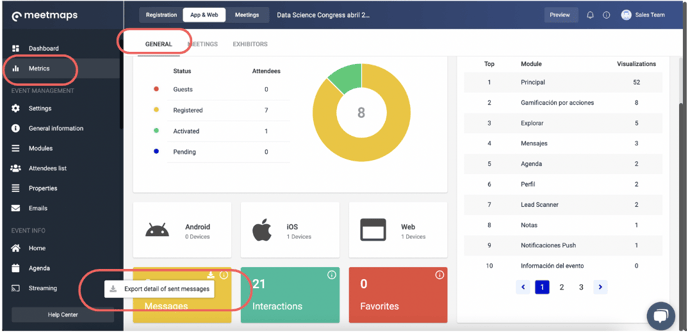
What is the Messages module and what is it for?
Interactions: records the number of profile visits between attendees from the app (turquoise box).
Favorites: number of agenda sessions, attendees, sponsors, and exhibitors that attendees have marked as Favorite⭐ from the app.
App & Web > Metrics > Meetings

App & Web > Metrics > Exhibitors
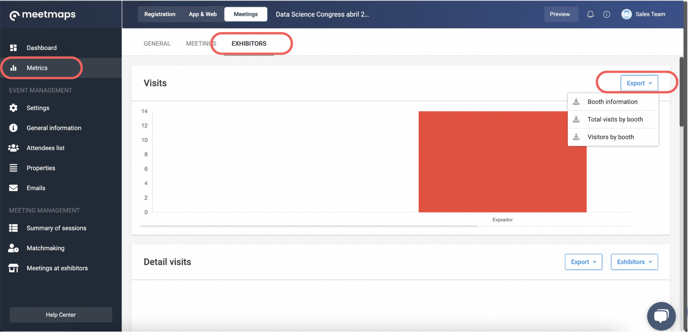
If you have set up premium exhibitors at your event, you will also access visit metrics from this tab. The available information and graphics are:
- Visits: You can download reports with the total information of the booths, the total visits per booth, and which users have visited each booth.
- Visit details: You can filter by booth for visitor details and also export them.
- Downloaded documents: You get the number of times documents from a booth have been downloaded.
- New contacts: details the attendees who have contacted the stand representatives.
- Meetings conducted: you can filter and download information on meetings conducted by stand.
- Meeting details: here you can download the reference of attendees who have met at each stand, indicating name, last name, company, and meeting status. Average
- Browsing time: information not yet available. Soon you will know how long an attendee has stayed at the stand, on average.
-
Section interaction: details the "clicks" attendees have made in the different sections of the booth, by booth: website, description, documents, contact button to send a message, request meeting button, social media. This information can also be exported.
For more information on these exports, you can obtain them from the same module. In case of doubts: in the articles of this Help Center about the module itself, you will find blue boxes about the EXPORTS 🔢.